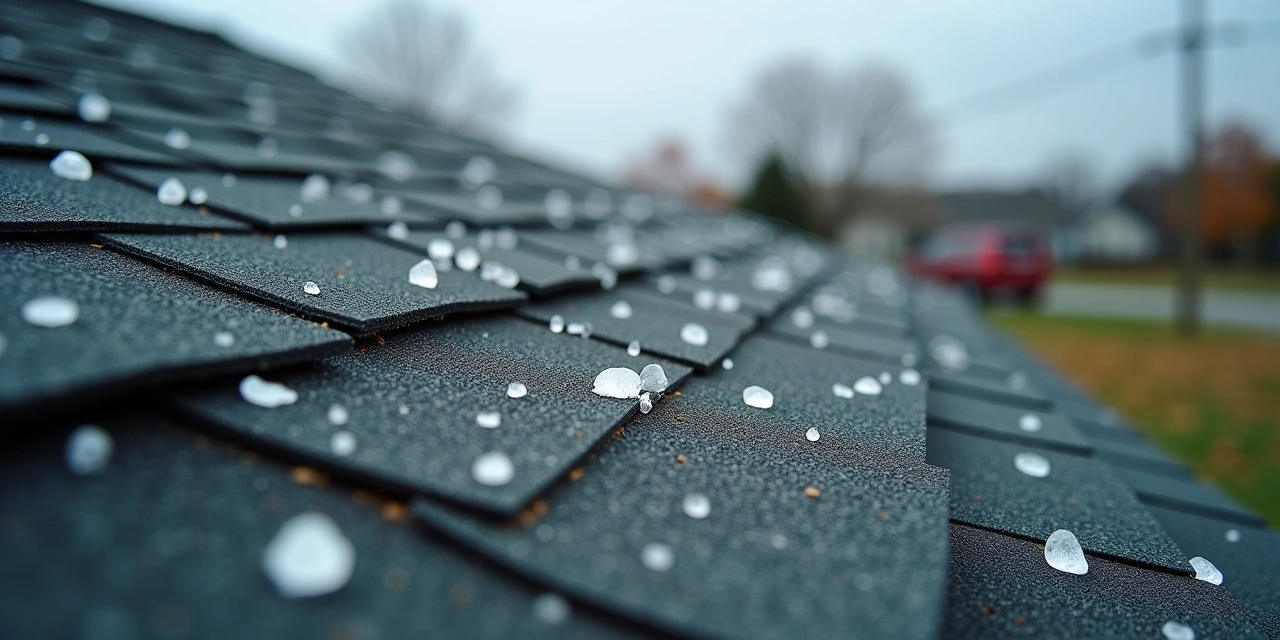
NOAA logged 2.12 hail days per year in Fairfield County, Ohio, 2000 to 2025 [1].
Many roofing sites claim Fairfield County gets 3 to 6 hail events a year. Some earlier pages on this site said it too. NOAA does not support that figure [1].
We pulled 26 full years of NOAA Storm Events data for four central Ohio counties. The result is smaller than the sales pitch. It is also not zero.
Below you'll find the yearly counts, the months, the hail sizes and the odds. You can also test the odds for each county.
Notice: This page is informational. It is not insurance, legal or engineering advice.
Fairfield Peak Roofing is a referral service. We are not an insurer, an adjuster or a roofing contractor. Check your own policy for coverage and deductibles.
Key Takeaways
- NOAA logged 2.12 hail days per year in Fairfield County, 2000 to 2025 [1].
- NOAA logged 26 Fairfield hail days of 1 inch or more, 2000 to 2025 [1].
- Franklin averaged 3.58 hail days a year against Fairfield's 2.12, 2000 to 2025 [1].
- NOAA's 2000 to 2025 Fairfield hail days peaked in July (15) and April (14) [1].
- April through July holds 48 of 55 Fairfield hail days, NOAA 2000 to 2025 [1].
- NOAA lists 14 Fairfield tornadoes for 2000 to 2026, none rated EF2 or higher [1].
- Fairfield had zero hail days in 2 of 26 years, 2004 and 2021 (NOAA) [1].
- NWS instruction 10-1605 (2007) says Storm Data entries may be unverified [5].
- IBHS's 2025 lab test linked small hail plus weathering to greater granule loss [8].
How many hail days per year does Fairfield County get?
NOAA logged 55 hail days in Fairfield County across 2000 to 2025 [1]. That averages 2.12 days a year, with a median of 2. A hail day is a calendar date with at least one county hail report.
The range is wide. Two of 26 years had no hail day at all, 2004 and 2021 [1]. The peak came in 2011, with 6 hail days and 12 hail reports [1].
Nine years had 3 or more hail days [1]. Four had 4 or more. Fairfield logged 94 hail reports in the same window, or 3.62 a year [1].
| Year | Hail reports | Hail days | Hail days, 1 inch or larger | Thunderstorm wind days |
|---|---|---|---|---|
| 2000 | 1 | 1 | 0 | 5 |
| 2001 | 2 | 2 | 0 | 4 |
| 2002 | 5 | 5 | 1 | 8 |
| 2003 | 2 | 1 | 1 | 8 |
| 2004 | 0 | 0 | 0 | 0 |
| 2005 | 1 | 1 | 0 | 4 |
| 2006 | 5 | 3 | 1 | 6 |
| 2007 | 6 | 4 | 2 | 11 |
| 2008 | 5 | 4 | 1 | 7 |
| 2009 | 5 | 3 | 1 | 3 |
| 2010 | 4 | 3 | 2 | 5 |
| 2011 | 12 | 6 | 2 | 12 |
| 2012 | 8 | 2 | 1 | 3 |
| 2013 | 2 | 1 | 1 | 4 |
| 2014 | 3 | 2 | 2 | 1 |
| 2015 | 1 | 1 | 0 | 2 |
| 2016 | 2 | 1 | 0 | 2 |
| 2017 | 2 | 2 | 2 | 6 |
| 2018 | 2 | 2 | 2 | 6 |
| 2019 | 2 | 1 | 0 | 4 |
| 2020 | 5 | 3 | 1 | 6 |
| 2021 | 0 | 0 | 0 | 1 |
| 2022 | 7 | 1 | 1 | 6 |
| 2023 | 6 | 3 | 3 | 4 |
| 2024 | 4 | 2 | 1 | 4 |
| 2025 | 2 | 1 | 1 | 6 |
| Total, 26 years | 94 | 55 | 26 | 128 |
Source: NOAA NCEI Storm Events Database, Fairfield County, 2000 to 2025 [1]. Independent. Reports are not true occurrences.
2 of 26
Fairfield years with zero hail days, 2004 and 2021, per NOAA 2000 to 2025 [1].
Any claim that hail hits every year fails on this count. Most years is safe.
We count days, not reports. One storm can file a dozen reports. Allen and Tippett (2015) studied US hail reports back to 1955 [6].
Report counts rose with storm chasers, report sources and local verification [6]. Hail days showed no national trend over the last 25 years of that study [6].
How does Fairfield compare with Licking, Pickaway and Franklin?
Franklin County averaged 3.58 hail days a year, Fairfield 2.12 (NOAA, 2000 to 2025) [1]. Licking logged 2.35 and Pickaway 0.96. Pickaway had no hail day in 11 of 26 years.
Franklin has many more people per square mile than Fairfield. That means more observers. Part of the Franklin gap reflects who is watching.
| County | Hail days a year | Median hail days | 1 inch or larger, a year | Expected hail days per 20 years | 95% interval |
|---|---|---|---|---|---|
| Franklin | 3.58 | 3.5 | 1.85 | 71.5 | 57.7 to 87.6 |
| Licking | 2.35 | 2 | 1.31 | 46.9 | 35.9 to 60.3 |
| Fairfield | 2.12 | 2 | 1.00 | 42.3 | 31.9 to 55.1 |
| Pickaway | 0.96 | 1 | 0.46 | 19.2 | 12.4 to 28.4 |
Source: NOAA NCEI Storm Events Database [1]. Independent. Expected hail days and intervals are this site's own calculation.
42.3 vs 71.5
Expected hail days per 20 years, Fairfield against Franklin. 95% intervals: 31.9 to 55.1 and 57.7 to 87.6.
Fairfield Peak Roofing's own calculation from NOAA counts. Formula in the methodology section.
Fairfield's total is 0.59 of Franklin's, or 55 of 93 hail days. The intervals nearly touch, at 55.1 and 57.7. Real counts cluster in bad years, so the true uncertainty is wider.
How often does hail of 1 inch or larger fall in Fairfield County?
NOAA counted 26 Fairfield hail days of 1 inch or larger, 2000 to 2025 [1]. That is 1.00 a year, with a median of 1. Eighteen of 26 years had at least one.
Only 2023 reached 3 such days [1]. The National Weather Service treats hail of 1 inch or larger as severe [4].
Most reports are small. Of 95 Fairfield hail reports in 2000 to 2026, 45 reached 1 inch [1]. That is 47%.
The median report was 0.88 inch. The largest was 2.50 inches on May 3, 2022 [1]. Six reports reached 1.75 inches or more [1].
| Size (inches) | Everyday comparison | Reports |
|---|---|---|
| 0.75 | Penny | 34 |
| 0.88 | Nickel | 16 |
| 1.00 | Quarter | 30 |
| 1.25 | Half dollar | 3 |
| 1.50 | Ping pong ball | 6 |
| 1.75 | Golf ball | 4 |
| 2.00 | Hen egg | 1 |
| 2.50 | Tennis ball | 1 |
| Total | 95 |
Source: NOAA NCEI Storm Events Database [1]. Independent. Everyday comparisons are conventional size guides, not NOAA data.
Haag Engineering ran lab tests on aged shingles with frozen ice stones [11]. Haag sells forensic hail inspections, so its figures are self-reported.
Aged 3-tab fiberglass shingles: 0% of impacts damaged at 1 inch, 60% at 1.25 [11]. At 1.5 inches, 90% of impacts caused damage [11]. Aged organic 3-tab shingles showed damage in 50% of 1-inch impacts [11].
Ice stones are harder than natural hail, and each test cell held only 10 impacts. Still, 1 inch is where older, thin products begin to fail. That is why we use it as our proxy for a damaging hail day.
Which months does hail fall in Fairfield County?
July had 15 of Fairfield's 55 hail days in NOAA's 2000 to 2025 data [1]. April had 14, June 12 and May 7. May is not the peak, despite what many roofing pages say.
| Month | Hail days | Hail days, 1 inch or larger |
|---|---|---|
| Jan | 0 | 0 |
| Feb | 1 | 0 |
| Mar | 3 | 1 |
| Apr | 14 | 7 |
| May | 7 | 5 |
| Jun | 12 | 6 |
| Jul | 15 | 5 |
| Aug | 1 | 1 |
| Sep | 0 | 0 |
| Oct | 1 | 0 |
| Nov | 1 | 1 |
| Dec | 0 | 0 |
| Total | 55 | 26 |
Source: NOAA NCEI Storm Events Database [1]. Independent. Months with no listed hail day are shown as 0.
April through July holds 48 of the 55 days, or 87% [1]. March through June holds 36, or 65%.
February, August, October and November had one hail day each in 26 years [1]. One-inch days split April 7, June 6, May 5 and July 5.
Storm-season advice that stops at June misses July. Roof checks fit best after April through July storms.
How many tornadoes has Fairfield County had?
NOAA lists 14 Fairfield County tornadoes for 2000 to 2026 [1]. Ten were rated F0 or EF0, and four were rated F1 or EF1. None reached EF2.
That works out to about 0.53 a year. None appear for 2026 through June 14, 2026 [1]. Paths ran from 0.02 to 4.67 miles.
Thunderstorm wind reaches Fairfield on more days than hail. NOAA logged 128 wind days from 2000 to 2025, or 4.92 a year [1]. That is more than twice the 2.12 hail days.
78%
Fairfield wind reports at exactly 50 knots: 165 of 212, 2000 to 2026 (NOAA) [1].
So many identical values mean these entries are damage reports, not measured winds.
NOAA records wind magnitude in knots [3]. Of 212 Fairfield wind reports, 181 are estimated gusts [1]. Only 12 were measured [1].
Days with a 50 knot report ran 4.73 a year [1]. Any wind report gave 4.92 [1]. The threshold barely filters anything.
So we do not publish a severe wind rate. The 4.92 figure counts days with reported wind damage.
NWS Wilmington confirmed 14 Ohio tornadoes from August 11, 2026 [18]. Three struck Franklin County [18]. The survey page does not list Fairfield.
The South Columbus EF1 had an estimated 100 mph peak wind [19]. Its path ran 1.8 miles. NWS says most damage came from straight-line winds of 60 to 80 mph [24].
A preliminary derecho classification lists an 82 mph Columbus gust [20].
How likely is at least one damaging hail day in the next 5, 10 or 20 years?
Fairfield's 2000 to 2025 NOAA rate implies a 63% yearly chance of 1-inch hail [1]. That covers the whole county, not your roof. Over 5 years the county figure passes 99%.
Observed years match the model. Eighteen of 26 Fairfield years (69%) had a 1-inch hail day, against 63% modeled [1]. The model treats hail days as random and independent, which real years are not.
Hail odds tool: pick a county and a time span
How to use this: pick a county, then drag the slider to set years ahead. The tool applies 1 - e^(-rate x years) to NOAA's 2000 to 2025 hail-day rates. Results are county-wide estimates from reported events, not a forecast.
Estimate from NOAA reports, 2000 to 2025 [1]. Reports undercount real hail. Hail days cluster, so real odds vary from year to year.
A hail day somewhere in Fairfield County is not hail on your roof. NOAA has no address-level hail data.
Your own odds are lower than the county's. We found no study measuring how much lower.
Why is the 3 to 6 events per year figure wrong?
NOAA's 2000 to 2025 record shows 2.12 Fairfield hail days a year [1]. Many roofing sites claim 3 to 6 significant hail events. Some earlier claims on this site did too.
NOAA does not publish a count of significant hail events [1]. We found no source for that figure. Table 5 sets eight common claims beside what NOAA's counts actually show for Fairfield.
| Claim seen on roofing pages | NOAA-derived figure | Verdict |
|---|---|---|
| Ohio averages 3 to 5 hail events a year of 1 inch or larger | Fairfield: 1.00 hail day a year at 1 inch or larger. Franklin 1.85, Licking 1.31, Pickaway 0.46. | Not supported for Fairfield. Statewide figure not computed. |
| Central Ohio averages 3 to 6 (or 4 to 6) significant hail events a year | Fairfield: 2.12 hail days a year, and 1.00 at 1 inch or larger. | Not supported. |
| The National Weather Service records 4 to 6 significant hail events a year | Neither NWS nor NCEI publishes an average of significant events. Fairfield: 2.12 hail days a year. | Not supported, and the attribution is wrong. |
| Franklin County gets 4 to 6 significant hail events a year | Franklin: 3.58 hail days a year and 1.85 at 1 inch or larger. Only 13 of 26 years had 4 or more. | Overstated. |
| Fairfield County averages more than 55 severe weather events a year, per NOAA | All Fairfield event rows, floods and heavy rain included, average 14.9 a year. Hail, wind and tornado fall on 6.42 distinct days a year. | Contradicted by the cited source. |
| Hail hits Fairfield County every year | Zero hail days in 2004 and 2021. 24 of 26 years had at least one. | False as written. "Most years" is safe. |
| Hail peaks in April and May | July 15 hail days, April 14, May 7. | Partly wrong. July ties April. |
| Spring 2026 brought several hail events and a confirmed EF-1 tornado to Fairfield County | NOAA through June 14, 2026: 1 hail report (March 7, 1.0 inch), 0 Fairfield tornadoes. The NWS Wilmington event pages we read name no Fairfield tornado. | Unsupported by any source we found. NOAA data may lag. |
Source: NOAA NCEI Storm Events Database, 2000 to 2025 unless noted [1]. Independent. Claim wording is paraphrased and not tied to one site.
The 55 events claim fails harder. NOAA's Fairfield rows, floods and heavy rain included, average 14.9 a year [1]. Hail, wind and tornado together fall on 6.42 distinct days a year [1].
Hail is a real risk. The sales pitch overstates how often it strikes. Where an older page here disagrees with this one, this page is the sourced one.
What do lab tests and insurers say about small hail and roof age?
IBHS tested 6 asphalt shingle products in a 2025 lab study [8]. Weathering plus small hail cost 16,503 mm2 of granules, against 9,287.5 for weathering alone [8]. IBHS is funded by the property insurance industry.
A 2 inch stone did about 9.6 times more damage to previously hit shingles [8]. The authors say impact-resistant shingles did only slightly better [8]. They also say a larger sample is needed [8].
Insurance Journal rounded that 9.6 to ten times [9]. We use the paper's figure.
Table 6 lists every outside figure used here, with a source flag. Most are national. Almost none name Ohio.
| Figure | Value | Source and year | Flag |
|---|---|---|---|
| IBHS lab test, 6 asphalt shingle products | Weathering plus small hail: 16,503 mm2 granule loss, against 9,287.5 for weathering alone. A 2 inch stone did about 9.6 times more damage to previously hit, weathered shingles. | IBHS, Frontiers in Materials, 2025 [8] | Independent Peer-reviewed. IBHS is insurer-funded. Small sample. |
| IBHS impact-resistant shingle ratings | 24 products rated, about 95% of annual impact-resistant shingle sales. Most rated Good, none Excellent. | IBHS, 2025-11-19 [10] | Self-reported |
| Haag hail damage thresholds | Aged 3-tab fiberglass: 0% damaged at 1 inch, 60% at 1.25, 90% at 1.5. Aged 30-year laminated: 0% at 1.25, 60% at 1.5, 100% at 2. | Haag Engineering, year not printed [11] | Self-reported 10 impacts per cell. Ice stones. |
| Ohio billion-dollar weather events | 105 events touching Ohio, 1980 to 2024. 69 (65.7%) were severe storms. 2.3 a year across all years against 7.2 a year in 2020 to 2024. | NOAA NCEI, 1980 to 2024 [12] [13] | Independent Multi-state events, whole-event cost. Series ended 2024. |
| US roof replacement and repair cost | 2025 average roof replacement $17,631 (up 33% on the prior 4-year average). Repair $4,699 (up 25%). Roofs in moderate-to-poor condition show about 60% higher loss costs. | Verisk via Claims Journal, 2026-06-01 [14] | Self-reported No Ohio figure. |
| US roof condition | 38% of US homes have moderate-to-poor roofs. Premium gap for newer roofs against 11 to 15 year roofs: $49 (2022), $155 (2025). | Verisk via Insurance Business, 2026 [15] | Self-reported No Ohio figure. |
| US insured severe convective storm losses | $51 billion in 2025, the third straight year above $50 billion. Roofs are 70 to 90% of insured residential catastrophic losses. | Triple-I citing Gallagher Re, 2026-04-14 [16] | Self-reported National only. |
| US days of 2 inch or larger hail | 142 days in 2025 against a 122-day 20-year average. 43.5 million US properties (about 42%) at moderate or greater hail risk. | Cotality, 2026-03-24 [17] | Self-reported National, 2 inch threshold. |
Fact-sheet flags: 2 of these 8 rows are independent and 6 are self-reported. Ohio-specific figures are rare.
Verisk says roofs in moderate-to-poor condition show about 60% higher loss costs [14]. Verisk sells the analytics, so that figure is self-reported. It points to age and condition, not to Fairfield hail counts.
Rising roof costs do not show more hail. Fairfield averaged 1.40 hail days a year in 2021 to 2025 [1].
The 2000 to 2020 average was 2.29. Five data points cannot establish a trend.
Age, ventilation and repeated wind wear shorten a roof's life too. See our guides on shingle lifespan in Ohio and cumulative wind and hail wear.
Does a hail report near me mean my roof needs an inspection?
NOAA's Storm Events Database lists reported hail by date, 2000 to 2026 [1] [2]. A listed date says when hail was reported, not what your roof took. The National Weather Service says outside information in Storm Data may be unverified [5].
A 1 inch report near your address deserves a look. Older, thin shingles can fail at that size [11]. Smaller hail on weathered shingles adds granule loss [8].
Much hail damage is hard to see from the ground. Our guide to assessing your roof after a hail storm shows what to check. Only an on-roof roof inspection settles it.
Ohio's insurance department says hail and wind damage is generally covered after deductibles [21]. Your deductible and policy terms vary. Read yours before you call anyone.
Lancaster homeowners can request an inspection through our roof inspection service. Contractors are independent. See storm damage repair and insurance for post-storm repairs.
What does NOAA not measure about hail?
As of 2026, NOAA's database has no figure for seven questions homeowners ask [1]. We list them so you know where the data stops. Where a proxy exists, we name it.
| Question | Why no data exists | Closest proxy |
|---|---|---|
| Hail size at your address | NOAA gives point reports from spotters and the public. Radar-derived products exist, but we found no free county table. | The nearest NOAA point report. |
| True hail occurrence | Every NOAA count is a report and undercounts real hail. Outside sources may be unverified [5]. SPC calls its live reports preliminary [7] | Hail days rather than reports [6] |
| Roof damage rate per hail day, size or roof age in Ohio | We found no Ohio field study. | Haag lab thresholds [11] |
| Share of Fairfield roofs ever damaged by hail | We found no field survey. | None. |
| Ohio insurer figures: percentage deductibles, roof claim frequency, Class 4 discount percentages | We found none published. Texas' form says some insurers may offer a discount and gives no percentage. | Texas DOI form [22]. State Farm says discounts vary by state [23] |
| Whether small hail (under 1 inch) matters in Ohio | The only lab work we found tested 6 products. | IBHS 2025 [8] |
| NOAA hail after June 14, 2026 | The 2026 file lags by about 3 months. | None yet. |
NOAA's damage values carry a warning. Only 18 of 95 Fairfield hail rows carry a dollar value [1]. Those 18 total $402K, and the largest is $200K on May 3, 2022 [1].
NWS staff enter those values as estimates, and they are not insured loss. Do not compare them to claim totals.
Storm Damage? Get Your Roof Inspected.
Your matched contractor documents damage for insurance claims and provides honest repair recommendations.
Frequently asked questions
NOAA logged 55 Fairfield hail days in 2000 to 2025, or 2.12 a year [1]. The median was 2 days. Two of 26 years had none, 2004 and 2021 [1].
NOAA data supports no hail trend claim for Fairfield [1]. Fairfield averaged 1.40 hail days a year in 2021 to 2025, against 2.29 before [1]. Five years cannot establish a trend, and reporting practices changed [6].
Haag Engineering's lab tests found damage starting near 1 inch on some aged shingles [11]. Aged 3-tab organic shingles: 50% of 1-inch impacts caused damage [11]. Haag sells inspections, so the figures are self-reported.
No, a NOAA hail report marks hail reported somewhere in the county [5]. The National Weather Service says such information may be unverified [5]. If the reported size was 1 inch or larger near you, book an inspection [11].
NOAA's Storm Events Database has a public search page [2]. The bulk files hold the full 2000 to 2026 record [1]. Save the dates next to your roof photos.
NOAA's 2000 to 2025 rate implies 99% odds of 1-inch hail within 5 years [1]. That is a Poisson estimate from reported events, not a forecast. It covers the whole county, not one roof.
Methodology: how we gathered this data
We logged 35 fact-sheet rows from 24 unique URLs, tiered by source quality.
- Source
- NCEI Storm Events detail files, 2000 to 2026, Ohio [1].
- Filter
- State Ohio, county zones only, event types Hail, Thunderstorm Wind and Tornado. Counties: Fairfield, Licking, Pickaway, Franklin.
- Hail day
- A distinct begin date with at least one Hail row for that county. A day counts once, whatever the report count.
- Years
- 2000 to 2025, 26 full years. The 2026 file ends 2026-06-14. So 2026 appears only in tallies labeled 2000 to 2026.
- Rate
- Hail days a year = hail days in 2000 to 2025 divided by 26.
- Odds
- P(at least one) = 1 - e^(-rate x years). Poisson model with rates from Table 2.
- Derived number
- Expected hail days per 20 years, Fairfield against Franklin. E20 = 20 x (hail days in 2000 to 2025) / 26. Fairfield: 20 x 55 / 26 = 42.3. Franklin: 20 x 93 / 26 = 71.5. Intervals are exact 95% Poisson bounds on the count, scaled the same way.
- Wind
- NOAA wind magnitude is in knots [3]. We publish wind days, not a mph severity rate.
- Self-reported split
- 9 of 35 fact-sheet rows are self-reported. 26 are independent.
- Exclusions
- Contractor blog figures with no primary source. Radar-indicated warnings, which are not confirmed reports.
- Source count
- The fact sheet holds 24 unique URLs on 17 domains. This page cites 22 of them plus 2 NOAA documentation pages, 24 references in all. Ohio Department of Insurance primary pages returned errors, so that source is a press relay.
- Last checked
- September 28, 2026. We re-check quarterly or when NCEI posts new months.
Some data here is stale. The NOAA 2026 file ends 2026-06-14.
Every 2026 figure here is labeled through June 14, 2026. July to September 2026 hail is not yet posted.
The NCEI billion-dollar disaster series ended in 2024 and cannot be refreshed after that year. The NWS instruction cited is the archived 2007 edition.
NWS moved the hail severe threshold to 1 inch in 2010. The 2000 to 2025 series mixes both eras.
NOAA counts are reports, not true occurrences. A 5-year against 20-year comparison is not a trend, and Franklin's gap partly reflects observers.
Last updated: September 28, 2026.
Sources and references
- NOAA National Centers for Environmental Information. Storm Events Database bulk detail files, 2000 to 2026 (Ohio, county zones). Data through 2026-06-14. https://www.ncei.noaa.gov/pub/data/swdi/stormevents/csvfiles/
- NOAA NCEI. Storm Events Database search page. https://www.ncei.noaa.gov/access/storm-events-database/search
- NOAA NCEI. Storm Data bulk CSV format documentation (wind magnitude in knots). https://www.ncei.noaa.gov/pub/data/swdi/stormevents/csvfiles/Storm-Data-Bulk-csv-Format.pdf
- NOAA National Weather Service, Binghamton office. Severe weather definitions (fetched 2026-09-28). https://www.weather.gov/bgm/severedefinitions
- NOAA National Weather Service. Instruction 10-1605, Storm Data Preparation, August 2007 edition (archived). https://www.weather.gov/media/directives/010_pdfs_archived/pd01016005d.pdf
- Allen and Tippett. Hail report biases, E-Journal of Severe Storms Meteorology 10(3), 2015. https://ejssm.org/archives/2015/vol-10-3-2015/
- NOAA Storm Prediction Center. Storm reports page, preliminary report notice (fetched 2026-09-28). https://www.spc.noaa.gov/climo/reports/
- Meisenzahl, Giammanco and Hedayati (IBHS). Frontiers in Materials 12, published 2025-09-29. https://www.frontiersin.org/journals/materials/articles/10.3389/fmats.2025.1603074/full
- Insurance Journal. Coverage of the IBHS hail study, 2025-10-02. https://www.insurancejournal.com/news/southeast/2025/10/02/842108.htm
- IBHS. Impact-resistant shingle ratings release, 2025-11-19. https://ibhs.org/ibhs-news-releases/ibhs-releases-its-most-expansive-impact-resistant-shingle-ratings-to-date/
- Haag Engineering Co. Asphalt shingle hail damage thresholds, AMS conference paper P3.2 (year not printed). https://ams.confex.com/ams/pdfpapers/45858.pdf
- NOAA NCEI. Billion-dollar weather and climate disasters, Ohio state summary, 1980 to 2024. https://www.ncei.noaa.gov/access/billions/state-summary/OH
- NOAA NESDIS. Notice of changes: billion-dollar dataset retired, 2025-05-08. https://www.nesdis.noaa.gov/about/documents-reports/notice-of-changes/2025-notice-of-changes/billion-dollar-weather-and-climate-disasters
- Claims Journal, citing Verisk. 2025 roof claim costs, 2026-06-01. https://www.claimsjournal.com/news/national/2026/06/01/337878.htm
- Insurance Business, citing Verisk. Roof risk indicators, 2026. https://www.insurancebusinessmag.com/us/news/property/roof-claims-severity-hits-record-highs-even-as-storm-activity-falls-verisk-data-shows-577150.aspx
- Triple-I, citing Gallagher Re. Severe convective storm insured losses, 2026-04-14. https://www.iii.org/press-release/triple-i-severe-convective-storms-generate-more-than-50b-in-insured-losses-for-third-consecutive-year-041326
- Cotality. Hail now a leading driver of insured losses, 2026-03-24. https://www.cotality.com/press-releases/hail-now-a-leading-driver-of-insured-losses-on-par-with-major-hurricanes
- NOAA National Weather Service Wilmington, OH. Confirmed tornadoes, August 11, 2026. https://www.weather.gov/iln/20260811
- NOAA National Weather Service Wilmington, OH. South Columbus EF1 survey, 2026-08-11. https://www.weather.gov/iln/20260811_s_columbus
- Spectrum News 1 Ohio. Preliminary findings indicate derecho, 2026-08-12. https://spectrumnews1.com/oh/columbus/news/2026/08/12/preliminary-findings-indicate-derecho-hit-ohio-tuesday
- Spectrum News 1 Ohio, citing the Ohio Department of Insurance. Insurance tips after severe storms, 2026-08-12. https://spectrumnews1.com/oh/columbus/news/2026/08/12/insurance-tips-for-ohioans-recovering-from-severe-storms
- Texas Department of Insurance. Form PC068, roof installation notice, 2023. https://www.tdi.texas.gov/forms/pcpersonal/pc068roofinstal.pdf
- State Farm. Impact-resistant roofing materials (undated, fetched 2026-09-28). https://www.statefarm.com/simple-insights/residence/impact-resistant-roofing-materials
- WOSU Public Media, citing NWS. More tornadoes confirmed from Aug. 11 storms, 2026-08-28. https://www.wosu.org/2026-08-28/national-weather-service-confirms-more-tornadoes-from-aug-11-storms-in-central-ohio
Cite this page and download the data
<a href="https://lancasterohioroofers.com/blog/fairfield-county-ohio-hail-frequency-noaa-data/">How Often Does Hail Actually Hit Fairfield County, Ohio?</a> (Fairfield Peak Roofing, 2026)Changelog
- 2026-09-28: Published. NOAA data through the files posted by June 14, 2026.
Storm Damage? Get Your Roof Inspected.
Your matched contractor documents damage for insurance claims and provides honest repair recommendations.